Panels 1.0.0 has released, new docs can be found on panels.bylazar.com .
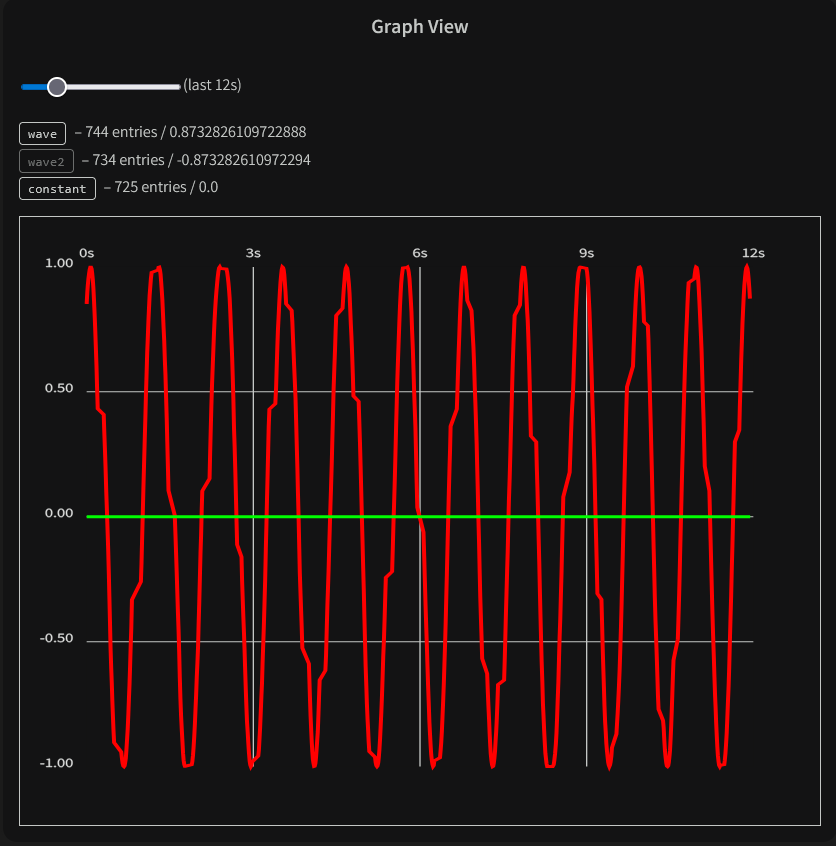
Graph View
The Graph View allows you to plot telemetry data as graphs, making it easier to understand trends, patterns, and anomalies in your robot's performance. It supports multiple data series and time scaling.
Useful for:
- Monitoring on sensor data.
- Tuning control system like PIDs.
- Identifying voltage-related issues.
Video Showcase
OpMode used in this example
package org.firstinspires.ftc.teamcode.examples.telemetry

import com.bylazar.ftcontrol.LoopTimer
import com.bylazar.ftcontrol.panels.Panels
import com.bylazar.ftcontrol.panels.configurables.annotations.Configurable
import com.bylazar.ftcontrol.panels.integration.TelemetryManager
import com.qualcomm.robotcore.eventloop.opmode.OpMode
import com.qualcomm.robotcore.eventloop.opmode.TeleOp
import kotlin.math.PI
import kotlin.math.sin

@Configurable
@TeleOp(name = "Test Telemetry Graph OpMode")
class GraphOpMode : OpMode() {
    companion object{
        @JvmField var ticksIncrement = 0.025
    }
    private val panelsTelemetry: TelemetryManager = Panels.getTelemetry()

    val timer = LoopTimer()

    var ticks = 0.0
    var wave = 0.0
    var wave2 = 0.0
    val constant = sin(0.0)

    val constant2 = sin(0.0) + 5

    override fun init() {
        panelsTelemetry.debug("Init was ran!")
        panelsTelemetry.update(telemetry)
        ticks = 0.0
        wave = 0.0
        wave2 = 0.0
    }

    override fun loop() {
        timer.start()
        ticks += ticksIncrement
        wave = sin(ticks)
        wave2 = sin(ticks + PI) * 2

        panelsTelemetry.debug("wave: $wave")
        panelsTelemetry.debug("wave2: $wave2")
        panelsTelemetry.debug("constant: $constant")
        panelsTelemetry.debug("constant2: $constant2")
        panelsTelemetry.graph("wave", wave)
        panelsTelemetry.graph("wave2", wave2)
        panelsTelemetry.graph("constant", constant)
        panelsTelemetry.graph("constant2", constant2)

        panelsTelemetry.debug("LoopTime: ${timer.ms}ms / ${timer.hz}Hz")

        panelsTelemetry.update(telemetry)
        timer.end()
    }
}
kt
The graph Function
The graph function is used to log data that will later be displayed on the graph view. It works with any numerical type (Int, Long, Double, Float).
Example for Logging Variables to the Graph:
panelsTelemetry.graph(
    "motorPower",
    sensorReading
)
kotlin
Using the Graph View Interface
Selecting Data Series
- On the left side of the Graph View, you will see a list of available telemetry keys.
- Click on a key to toggle its visibility on the graph.
- Multiple keys can be selected to compare different data series simultaneously.
Time Scaling
- At the top of the graph, there is a slider that controls the time window displayed.
- Adjust the slider to zoom in or out on the timeline.
A library by Lazar from 19234 ByteForce.